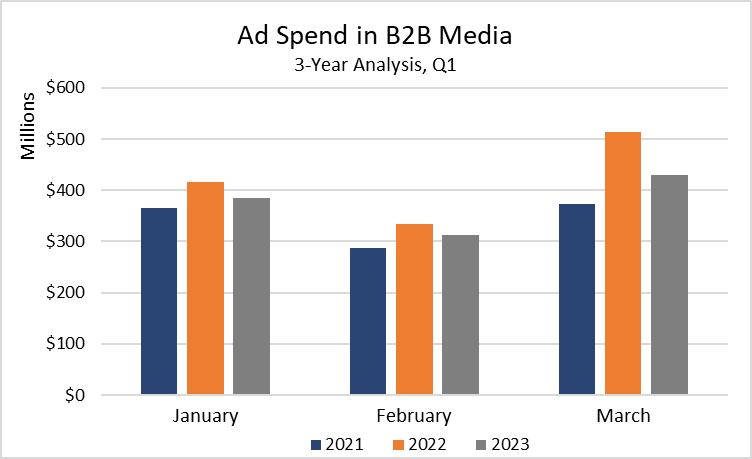
When we last wrote about the state of B2B media, it seemed like advertisers were turning the corner after pumping the brakes during the pandemic and potential recession. Through Q3 2022, advertisers increased spending on B2B digital and print publications by 2% YoY.
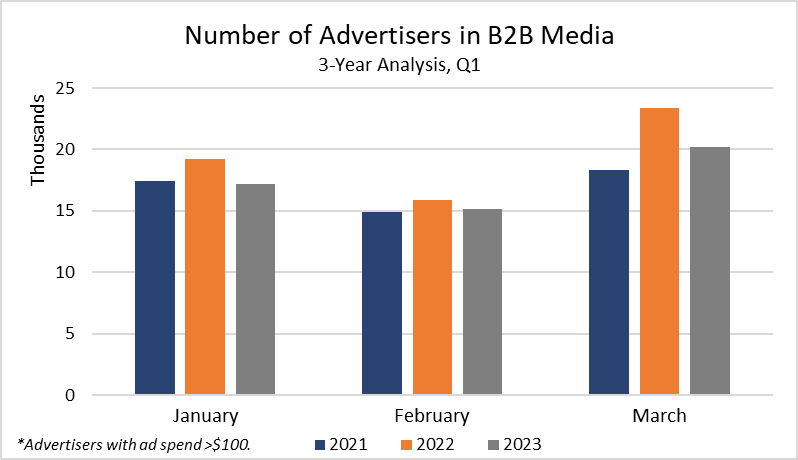
Despite the pandemic getting farther in the rearview mirror, B2B spending has fallen again due to economic turmoil, rising inflation, and declining consumer confidence. As a result, advertisers in some industries, including pharma, software, and insurance, have reigned in their B2B media budgets. Overall, B2B print and digital publications spending decreased by 11% YoY in Q1 2023 ($1.1b down from $1.26b), while the number of advertising buying B2B media fell by 8% YoY.


That said, other advertisers, especially those in tourism and construction, have upped their investment as their industries stayed relatively insulated from the outside pressure.
Here’s how those advertisers invested in B2B media in Q1 2023.
| Top Segments Increasing & Decreasing Ad Spend in B2B Media Q1 2022 vs Q1 2023 | |||||
| Segment | Est. Spend in millions | YoY | Segment | Est. Spend in millions | YoY |
| Building Materials & Tools | $21.2 | 10% | Pharma Companies | $79 | -10% |
| Chemicals | $21.2 | 8% | Software | $53 | -34% |
| Colleges & Universities | $18.6 | 6% | Professional Services | $40.7 | -10% |
| US Tourism | $13.3 | 126% | Agriculture & Farming | $19.7 | -13% |
| Construction Equip. & Materials | $12.9 | 89% | Insurance | $14.8 | -44% |
| *Industrial Machinery was flat YoY in Q1 2023 at nearly $28mm. |
Tourism Advertisers Lead the Way
In Q1, tourism advertisers for U.S. cities, counties, and state tourism bureaus increased their investment in B2B media by 126% YoY to $13.2mm as the travel industry sprung back to life.
Advertisers for California Tourism ($2.3mm) and Florida Tourism ($2.4mm) were significant contributors, accounting for 38% of the spend thanks to increases of 187% (to $2.3mm) and 64% YoY (to $2.4mm), respectively. For tourism advertisers investing in B2B media, spending comes in the wake of a year in which the industry rebounded in a huge way.

At the beginning of 2022, the World Travel & Tourism Council (WTTC) announced its newest economic modeling. Julia Simpson, president and CEO of WTTC, said, “Our latest forecast shows the recovery significantly picking up this year as infection rates subside and travelers continue benefiting from the protection offered by the vaccine and boosters.”
That positive outlook was spot on.
Overall, the market size of tourism worldwide totaled around $2 trillion in 2022 and is expected to rise to nearly $2.29 trillion this year.
The rebound, combined with the demand for travel despite low consumer confidence—74% of American travelers plan to fly domestically by August—should put tourism advertisers in a prime position to spend on B2B media.
Construction Equipment & Materials Advertisers Get Back to Building
Headlines during the pandemic highlighted historically high prices. Used car prices, for example, posted their most significant annual increase ever when they jumped by 45% in the 12 months ending in June 2021.
The construction industry also experienced unprecedented supply-and-demand challenges that took the cost of goods to new heights. According to data from the U.S. Department of Agriculture released in May 2022, wholesale prices for plywood increased from $400 to $1,500 per thousand square feet.
That undoubtedly impacted how construction equipment and materials advertisers invested in B2B media. However, the industry is back into a higher gear—the construction industry is expected to grow by 6.1% in 2023—and advertisers are spending.
In Q1, spending on B2B media from construction equipment & materials advertisers increased by 89% YoY. Almost half of that (44%) came from advertisers promoting construction equipment (up by 58% YoY), including newcomers such as Case Construction Backhoe Loaders. At the same time, spending from advertisers pushing industrial concrete, which accounted for 10% of the category’s spending, increased their budgets by 920% YoY.
Other related advertisers, including those for building materials and tools, including granite, tile, wiring, and power tools, increased spending as well. Advertisers promoting power tools, in particular, increased their investment in B2B media by 12% YoY. Meanwhile, advertisers for fasteners (hardware) increased spending by 34% YoY to $566mm.
Although many construction equipment and materials advertisers started 2023 with a renewed interest in B2B media, rising inflation and supply and labor challenges will put some projects on hold, namely residential properties. Mortgage Bankers Association said applications declined 13.2% for the week ending December 30, 2022, representing the lowest reading since 1996.
At the same time, companies are pausing the construction of data centers started during the pandemic. In December 2022, Google announced it was pausing construction of its $6mm data center project. Meta made a similar move the same month, announcing it was pausing the construction of the new data center it started building that September.
The economic headwinds already impacting projects, including at some of the world’s biggest companies, will persist in 2023 and put more pressure on advertisers and how they spend on B2B media.
What’s it Mean for Everyone Else?
Not all advertisers are pushing through the economic pressure, shifting buying behaviors, new technology, and overall B2B transformation as well as those promoting tourism, construction and materials.
Advertisers for advertising and marketing software, for example, decreased spending on B2B media by 25% YoY. Even spending from eCommerce software advertisers dropped in Q1 despite the rise of entrepreneurship during the pandemic.
Meanwhile, advertisers for Exchange Traded Funds (ETFs) and banks both decreased B2B media spending by 35% YoY as financial pressure reduced the demand for their products and services.
Finally, pharma advertisers, including those for over-the-counter (OTC) medications, pharma companies, and prescriptions, decreased spending by 10% YoY to $79mm. Among the detractors, advertisers promoting breast cancer prescriptions reduced spending by 64% YoY to $3mm, while those for lung cancer prescriptions did so by 62% YoY to $2.3mm.
For pharma advertisers, the reduction is more likely a reallocation than a sign of trouble. As they increasingly adopt digital, budgets must come from different channels and B2B media may be on the chopping block.
For advertisers cutting their budgets due purely to environmental factors, how they spend on B2B media will continue to align with the market’s ebbs and flows.
For more insights, sign up for MediaRadar’s blog here.


